About Statscraft
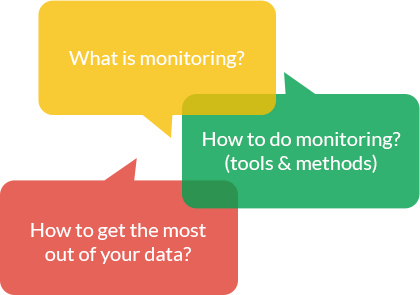
This conference is all about making monitoring easier, more accessible and more productive
Monitoring is crucial for detecting problems, optimizing performance, capacity planning, improving user experience and business impact... Yet in many companies, monitoring is an afterthought leading companies to miss out on the value of the data they collected. We often hear that "monitoring is hard" - and it can be, unless we do something about it.
Agenda
*this conference is Kosher and all talks are in biblical Hebrew
Gathering and Signup
Opening Words
Monitoring Like a Human With Synthetics
Summary
Oftentimes, the biggest issues in our applications are caused by the people that use them. The real human users of our services can cause us big headaches. A robust synthetics monitoring suite can step into the place of a human user and save us before the real humans ever show up and mess up our perfectly working applications! Come and learn how to effectively use synthetics to detect issues before anyone else does. Once you embrace synthetics monitoring, you'll never want to go back!
YouTube Video
The Way to Truly Build Infrastructure as Code Starts With Building Monitoring as Code
Alon Dotan
Infrastructure Team Lead @ StarkwareSummary
In the last couple of years, the infrastructure as code concept is taking more and more space from right and obvious reasons. If we know to manage code deterministically, methodically and based on processes that involved automation reviews - There’s no reason why we shouldn’t do it in the infrastructure realm as well. In this talk, I’ll focus on the monitoring space which is, in principle, a derivative of the infrastructure realm, and how we manage and maintain our monitoring by utilizing infrastructure as code, as opposed to common concepts of managing monitoring manually, detached from the code in which we want to monitor. I’ll show that by leveraging this concept, we gain easier and better day-to-day maintenance, higher flexibility, more efficient and methodical review processes and a perfect compatibility between the monitoring system and the product it monitors.
YouTube Video
Building your monitoring in the MultiCloud
Shalom Yerushalmy
Devops Team Leader @ CyeraExperienced Team Lead with a demonstrated history of working in the internet industry. Skilled in Linux System Administration, Bash, DevOps, Mobile Applications, and Java.
Summary
If it is not monitored then it does not work. This is one of the first rules I learned when I started working in the field. How to find and find the common denominator for each cloud? Use open source tools that can run regardless of the cloud? What metrics do you need and what logs do you want and need? How to set the alerts to be as understandable as possible when there are several areas in several different clouds. Join me for the adventure in the multicloud of madness.
YouTube Video
Break #1
Navigating In The Dark

Nati Cohen
Solutions Architect @ AWSNati is a solutions architect with AWS. He delights in helping customers simplify complex systems, teaching them about the inner workings of cloud services and debugging annoying technical oddities. When he is not at his computer he is soldering electronic kits, tinkering with smaller computers and drumming on a Taiko.
Summary
In recent years an increasing amount of resources is invested in system observability, notification management and incident response. While these systems provide us with better visibility into our applications and shorten the time to mitigation, what happens when both suffer an outage? In this talk we will review the different ways we can find ourselves flying blind, what other systems and processes are likely to suffer a correlated failure, and what can we do about it.
YouTube Video
Into the Flamegraph - From the Primitives through Advanced Concepts

Yonatan Goldschmidt
Principal Engineer @ GranulateYonatan Goldschmidt is a Team Lead at Granulate, overseeing the development and deployment of their real-time continuous optimization solution as an expert in low-level programming. Before joining Granulate, Yonatan served for nearly six years in the Israel Defense Forces as a Team Lead and R&D Specialist.
Summary
Production profiling is no new challenge in the operations world. Companies with huge data center scale from the Googles to the Facebooks have long moved into continuous cross-cluster production profiling, to constantly optimize performance and SLAs, which has not yet carried over universally. In this talk we walk you through the basics from how to use modern continuous profiling tools, how to read a flamegraph, and what to look for with a real-world demo in modern complex, microservices environments. It will continue to advanced profiling of cluster deployment, code performance profiling over time, and even how to provide feedback loops for developers to optimize performance from the foundations of their code.
YouTube Video
A Log Story: Improving Testing Quality through Proper Analysis

Gabriel Liechtman Manor
Technical Leader @ JitA senior full-stack developer with a favorite kid named Frontend. For over ten years now, I've enjoyed writing clean code, simplifying complex problems, leading feature development, and influencing innovation every day. When I’m not busy with code, you’ll find me talking about application performance, building confidence in code-bases, product architecture, developing organizational culture, and other nerdy dev stuff. Besides all that, I'm a father of two, a hobbyist photographer, lego builder, and food creator.
Summary
At a company that runs 4000+ automated integration test cases handling many external systems - from Selenium for testing, through networking equipment, and packet generation, like many companies we used pass/fail as the sole indicator for our testing quality gate. Due to a whole bunch of external factors such as connectivity and stability of third-party systems, our pass rate was consistently lowered, until 70% became the average pass rate. We knew that this was almost as bad as a coin toss, and decided to dig deeper & solve this technical debt from the source, once and for all. By investigating the logs using log analysis tools to detect patterns in the failed and passing tests, we were then able to build dashboards to help track the trends. Based on these we went to work building a smarter framework for exception classification, that enabled us to create the right tools that ultimately helped us to increase our quality gate to 98%, with a much more detailed view of every test run and easy debugging of external issues. This talk will walk you through this use case from the problem, through the final implementation, and how to think about solving similar problems in your systems.
YouTube Video
Context propagation in OpenTelemetry: Beyond “Hello World” examples

Natasha Chernyavsky
Senior Software Engineer @ HeliosNatasha is a senior software engineer at Helios, where she was one of the first employees. Previously, Natasha was an R&D team leader and software architect at Oribi. Natasha has over a decade of development and management experience in the industry and in the IDF. She loves solving complex problems and even more so when the solutions are beautiful. Is especially fascinated by data and everything that handling it entails whether its modelling, processing, storing and querying up to its performance tuning.
Summary
In today’s world, Distributed Tracing is known to take observability to the next level, and OpenTelemetry, the second most active open source project in the CNCF after K8s, provides a realization of it through (almost) seamless integration. However, successfully integrating it into one's environment is not as easy as it sounds and many hit a brick wall when the simple “Getting Started” instructions fail them and their traces break mid-flow. In this talk, I’ll explain about context propagation, a key concept in Distributed Tracing, why it can be tricky to implement and give some real-world examples of how it can be achieved. I Hope you’ll be able to easily identify where context breaks in your system and encourage you to get creative with propagating context, so that you can, too, benefit from the advantages distributed tracing offers.
YouTube Video
Break #2 - Lunch
The importance of people, processes, and technology for 24/7 operations

Eyal Elhadad
Senior Solutions Architect @ MoovingONEyal Elhadad is a Senior Solutions Architect with MoovingON. Eyal has more than 20 years of experience in managing and leading large SAAS operations teams (IBM, Amobee etc..), which spanned over different roles including IT, DevOps, support, NOC, with extensive experience in defining, optimizing, and implementing processes to ensure high quality 24/7 operational groups.
Summary
SaaS environments today are extremely complex and require knowledge alignment and full collaboration between team members. In this session we will discuss how to maintain productive and accurate ongoing support for 24/7 environments using People processes and technologies. The challenge today is the ability to align quality between all team members as we all understand the strength of operational process is strong as the weakest link in the process. I will share my vast experience in startups as well large enterprise with the audience, I will talk about the alignment needed during a growth of the company from a young startup to a mature operation.
YouTube Video
Are your customers utilizing your product's potential?

Maayan Kfir
Senior Client Services Product Analyst @ AppsFlyerMaayan is a Senior Product Data Analyst at AppsFlyer. She holds a unique role as part of the Client Services group as the connector between product and business. She thrives on bringing valuable and actionable insights through analytics and visualizations. As an experienced subject matter expert, Maayan is also a professional mentor for younger team members at AppsFlyer and leads social projects to expose women and young girls to the world of high-tech.
Summary
Having an awesome product is great, but how will you know if your customers know it’s an awesome product? Measuring the usage of your SAAS product looks different in every vertical, company, and feature. But the concept is the same. Customer Success Managers (CSMs) have to know what features are being used and how they are being used. If not, they’ll lose track of what brings value to their customers and they will eventually lose their attention and their trust. In this talk, I’ll present how monitoring feature usage can be tricky, require resources, collaboration and creativity, but will eventually bring the CSMs to the next level as professional advisors, and benefit both the company and the customer. Most of all, monitoring product usage this way will show if the value is indeed being delivered as intended. We’ll talk about how we measure the usage of all of our features, how we have a dedicated person to do this (me) and how we actually monitor this data - in dashboards presenting visualized data, via processes implemented in our CRM and more.
YouTube Video
Monitoring Road Traffic, Monitoring Internet Traffic - Why Not Both?

Ofir Marcus
Chief Architect @ NoTrafficOfir Marcus, NoTraffic's Chief Architect. I have written code for cloud and ground applications for ten years. I'm very much interested in monitoring, security, IoT and other technical stuff. I like tennis cats and dad jokes
Summary
In the lecture we will explain how NoTraffic monitors their edge devices, and also the interactions in traffic light intersections In the IoT world there are constraints which don't exist in the cloud, since the resources are limited. Furthermore, we use video cameras, Radar and other sensors for information gathering. This lecture is relevant for people in the fields of software, operations, product, or anyone who is interested in this field
YouTube Video
Break #3
Trace-Based Testing with OpenTelemetry

Michael Haberman
Co-founder and CTO @ AspectoMichael is the Co-Founder and CTO of Aspecto, a distributed tracing platform. After serving as a software developer in an elite unit in the Israeli Intelligence branch, Michael worked with a few startups on building and scaling their microservices infrastructure. Prior to co-founding Aspecto, he was the Chief Architect at Playbuzz. In his free time, Michael also lectures and conducts workshops on distributed services at conferences.
Summary
Companies these days use distributed tracing for critical functions such as performance monitoring and troubleshooting, allowing DevOps, developers, and SREs to find and fix issues in production after they happen. But here is the thing, they don’t use tracing to its full potential. There is another use case for tracing data, and that is trace-based testing. This new method allows you to improve assertion capabilities by leveraging traces data and making it accessible while setting your expectations from a test. We will introduce you to a new open-source called Malabi - a Javascript framework based on OpenTelemetry that allows you to easily use trace data to take your assertion capabilities to the next level. By the end of this session, you will know how to use trace-based testing to increase your tests’ reliability and possibly prevent issues early in the development cycle.
YouTube Video
I Have an APM Addiction

Boris Cherkasky
Software Engineer and Production Advocate @ RiskifiedA software engineer with passion (some say obsession) for observability, charts, and dashboards. In the last ten years, did anything from low-level safety-critical control logic to high availability cloud applications, and currently enabling e-commerce as an engineer and production advocate at Riskified. Amature tech blogger, mediocre cook with a slight Scuba diving addiction.
Summary
Up until recently, I had a terrible addiction - I was addicted to our APM vendor. As with every addiction, the road downhill was a gradual process - it started with being dazzled by endless observability possibilities, using it heavily in the services I was developing, and using it on a daily basis. But 3 years later, I was abusing it - mixing up monitoring primitives, using it on every little service, and generally just overspending on it. In this talk, we’ll explore why APMs are amazing, but at the same time, prone to misuse, expensive, and can get out of hand quite easily. We’ll cover the pitfalls of using APMs, while on the other hand - exploring where APMs are a must and will save your on-call nights.
YouTube Video
The Only Two Metrics You Should Show to Your CEO

Yishai Beeri
CTO @ LinearBYishai Beeri likes to solve problems, and that's why he was so fascinated with programming when first encountered Logo back in the 80s, where the possibilities seemed endless. He has made it a focus of his career to solve complex programming problems, both as a consultant and entrepreneur. In 2014 he joined the CTO office of a fast-moving cloud security startup, which later was acquired by a networking giant. At this startup he also met Ori Keren and Dan Lines, now co-founders of LinearB. He joined them shortly after the company was established, in order to get back to what he loves most about engineering, solving big challenges, and this time he is focusing on the world of dev team metrics and software delivery management.
Summary
The business cares about two things when it comes to engineering projects: Is the project on time? Can we speed it up? In this session I will give you the two metrics that matter most when answering these questions.
YouTube Video
The Polyglot Cloud Native Debugger - Going Beyond APM and Logs

Shai Almog
Developer Advocate @ LightrunDeveloper advocate for Lightrun, co-founder of Codename One, open source hacker, speaker, author, blogger, Java rockstar and more. ex-Sun/Oracle guy with 30 years of professional development experience. Shai built virtual machines, development tools, mobile phone environments, banking systems, startup/enterprise backends, user interfaces, development frameworks and much more. Shai speaks at conferences all over the world and shared the stage with luminaries such as James Gossling (father of Java). Shai is an award winning highly rated speaker with a knack for engaging the audience and deep technical chops.
Summary
All the unit tests & the largest QA team still can’t stop bugs from slithering into production. With a distributed microservice architecture debugging becomes much harder. Especially across language & machine boundaries. APMs & logs provide the first steps. But in these crucial moments we need something more. Production bugs are the WORST bugs. They got through unit tests, integration, QA & staging... We cross our fingers, put on the Sherlock Holmes hat & hope the bug made it into the log... If not our only remedy is more logging. That bogs performance for everyone & makes logs damn near unreadable. We have no choice other than crossing our fingers & going through CI/CD again... again... again... With developer observability we can follow a specific process through several different microservices and “step into” as if we were using a local debugger without interrupting the server flow. In this session I will demonstrate such an approach and how everything integrates with common production frameworks.
YouTube Video
Microservices Optimized Monitoring & Observability FTW!

Itiel Shwartz
Co-founder & CTO @ KomodorItiel is the CTO and Co-founder of Komodor, a startup building the first k8s-native troubleshooting platform. He’s a big believer in dev empowerment and moving fast. He previously worked at eBay (Forter) and at Rookout as the first developer. A backend and infra developer turned “DevOps”, he’s an avid public speaker that loves talking about things such as cloud infrastructure, kubernetes, python, observability, and R&D culture.
Summary
Microservices systems are extremely powerful - providing highly distributed and sometimes infinite scale. However, this can also be a double-edged sword from an operations and management perspective. This talk will dive into some good practices for designing and embedding monitoring and observability best practices from day one for complex microservices operations. These life lessons were earned firsthand from working with large-scale, microservices systems daily for the last four years, and experiencing the challenges of ultimately troubleshooting and maintaining this complex system at scale - tips I wish someone had shared with me when I was just getting started with microservices.
YouTube Video
Monitoring Kubernetes Vs. Serverless based applications

Erez Berkner
CEO & co-founder @ LumigoErez is the CEO & co-founder of Lumigo, a startup focusing on simplifying serverless applications troubleshooting, where the entire backend is... 100% serverless. Prior to founding Lumigo, Erez was the R&D director of cloud products at CheckPoint, heading the company’s cloud strategy & execution.
Summary
The software we write does not always work as smoothly as we would like. In order to know if something went wrong, understand the root cause and fix the problem, we need to monitor our system and get alerts whenever issues pop up. There are many useful tools and practices for Kubernetes-based applications. As we adopt serverless architecture can we continue to use the same practice? Unfortunately, the answer is no. In this session we will discuss: The differences between monitoring Kubernetes and serverless based applications Best practices for serverless monitoring Methods to efficiently troubleshoot serverless based applications
YouTube Video
Peaceful production oncall - it's not a dream
Dalia Simons
Backend tech lead @ WixI'm an experienced software engineer, writing backend code has been my passion and my career for the last 16 years. I believe that keeping your code simple and readable is the key to easily maintaining it over time
Summary
It’s 5:03 AM, You’re fast asleep, but your phone rings and cruelly wakes you up. Who can that be??? Oh no, you’re on-call this week! Sounds familiar? Production on call duties can be very stressful, but it doesn't have to be this way. Our on-call duty used to be a disaster, with many alerts and a feeling everything is constantly on fire. In this talk I will share what we did to make it peaceful again, I will show practical steps that worked and didn’t work, and share what I think the secret is for a peaceful production maintenance. I will also introduce internal tools we created to help us understand and analyze the alerts better. I will cover alert fatigue, service ownership, finding root cause, service maintenance so that you can improve your on-call and sleep well at night.
YouTube Video
How to alert on high cardinality data with Grafana Loki
Amnon Heiman
Principal Software Engineer @ ScyllaDBSummary
Metric based alerts are an important tool when it comes to monitoring systems. A common problem a lot of us are facing is- How do we add data to alerts without creating a large amount of metrics (The cardinality issue). In this talk I will demonstrate how to use Grafana’s Loki, in combination with Prometheus, in order to create informative alerts, and maximize our use of Loki & Prometheus.
YouTube Video
The Golden Metrics - One Metric to Rule Them All
Alon Nativ
Head of Environmental Analytics @ Tomorrow.ioAlon is a developer at heart and a monitoring freak, for the last 15 years he has been building systems as developers, managing large teams and hacking systems. he's passionate about building large scale systems, and the process of making an impact, always looking for a way to improve the development process and optimize the system. A Public speaker, talking about development at the reversim podcast (for ~8 years), mentoring managers & speakers, And most importantly - Father of 3 kids and husband of an amazing wife :)
Summary
We all love creating metrics! it’s fun and helpful. But sometimes we are missing some metrics. What happens if I’ll tell that you can create only one metrics to each server? is it possible? how would you create it? Let’s talk about the Golden metrics and why it is a good idea. After many times that our one of our servers stopped working and none of our monitors catch it, we decided to try a new approach. We call it the “Golden Metrics”. Now each service can have one (yes ONE!) metrics that tell us if it is working or now. In this talk I would like to go over a “real world example” of one of our services and talk about the monitors that we had and what did we miss. How the golden metrics approach change the way that we write and talk about our metrics.
YouTube Video
End Of Day - HAPPY HOUR
Sponsors


Organizing Committee
This conference is a community effort by and for people who do monitoring daily and care about monitoring. The organizing committee are all volunteers and sponsorships cover the direct costs of the conference.


Ben Greenberg
Lead Developer Relations Engineer - EMEA @ New RelicBen is a second career developer who previously spent a decade in the fields of adult education, community organizing, and non-profit management. He works as a lead developer relations engineer at New Relic by day and is building hirethePIVOT, a reverse job board for career changers, at night. He writes regularly on the intersection of community development and tech. Originally from Southern California and a long-time resident of New York City, Ben now resides near Tel Aviv.