About Statscraft

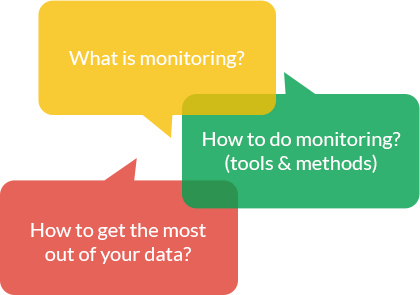
This conference is all about making monitoring easier, more accessible and more productive
Monitoring is crucial for detecting problems, optimizing performance, capacity planning, improving user experience and business impact... Yet in many companies, monitoring is an afterthought leading companies to miss out on the value of the data they collected. We often hear that "monitoring is hard" - and it can be, unless we do something about it.
Agenda
*this conference is Kosher and all talks are in biblical Hebrew
The Problem (keynote)
Summary
Monitoring is hard.
Monitoring is non-functional, but at the same time, resource hungry.
Monitoring requires the right people.
#monitoringsucks because we're doing it wrong.
We'll review the problem, which, as always, originates with people, not tools.
Slides
YouTube Video
Intro to Monitoring

Yoav Abrahami and Mark Sonis
Wix's Chief Architect and Monitoring team leaderYoav Abrahami is the Chief Architect at Wix.com, working with developers and operations on building Wix's future products as well as accelerating and improving development processes. Prior to joining Wix.com, Yoav was an Architect at Amdocs Cramer OSS division. Yoav has a MS in Physics and BS in Computer Science from Tel Aviv University.
Mark is a Mamram alumni, with over 13 years of experience in operations. As a monitoring Ninja at Wix he's responsible for building a fully automated monitoring solution for the multi-micro-services / wide-distributed / high-frequency-changing production environment. My loves, in order, are: Hangout with my gorgeous family, diving in theoretical physics and creatively solve problems as a sport.
Summary
So we have deployed an application. It is running. How do we verify it keeps on running? How do we get notified fast about any issues with the application? How do we garantee the service level we want to provide our customers?
The magic answer is to monitor our application. But wait, what does it mean to monitor? What metrics should we monitor? What is the effective way to monitor those metrics? what about alerts?
In this talk we will explore a simple browser - server - database application with regard to monitoring. What role have end user experience monitors, server side performance, operation, error and system monitors, database monitors as well as alerts.
Slides
YouTube Video
Break
Monitoring with Riemann

Moshe Zada
Problem Solver @ ForterMoshe is passionate about new technologies, coding, providing tools and VIM hacks. Currently Moshe is a problem solver at Forter and among other stuff leading Forter’s monitoring with Riemann and ELK stack.
Summary
Forter has been using Riemann for more than a year in production to monitor our highly complex, distributed system. We are using Riemann as our hub for alerts (PagerDuty), latency and exception reporting (Kibana) and system probes (Jenkins). This presentation will cover Riemann patterns for maintenance-mode, state machine based alerts, statistical alerts, system and integration tests based alerts, event enrichment and aggregation for reporting.
Slides
YouTube Video
Monitoring - A Top down approach

Shahar Kedar
Director of Engineering @ BigPandaWith over 10 years of experience, Shahar has been doing everything from hands on programming to complete system architecture. As Director of Engineering at BigPanda, He's responsible for designing and building the IT and software infrastructure that makes BigPanda tick. His passions in life (in this order): his wife and son, gourmet, cinema and code as craft.
Summary
Monitoring should not be about tools but rather about choice. For two decades, the choice of what should be measured and monitored was dictated by the tools avaialble. Now however, with the exlposion of Open-Source and SaaS, the question should no longer be "What can I monitor?", but rather "What should I monitor?" - a much harder but more important question to answer.
Slides
YouTube Video
Lunch
Data analysis with Graphite

Avishai Ish-Shalom
CTO @ FewbytesAvishai is a veteran ops and a survivor of many prod skirmishes. Currently masquerading as the CTO of Fewbytes - a consulting company for Ops and architecture.
Summary
"With great power comes great confusion".
It is not enough to generate, collect and store metrics; One needs to know how to look and analyse them to get the full benefit of metrics. In this workshop we will learn how to use metrics to detect problems, correlate and investigate issues. This is a hands-on workshop. Although the workshop will use Graphite the methods are not Graphite specific.
Monitoring with ELK

Tomer Levy and Asaf Yigal
Logz.io's CEO and VP ProductTomer Levy is co-founder and CEO of Logz.io. Before founding Logz.io, Tomer was the co-founder and CTO of Intigua that developed innovative, Docker-like containers designed for large enterprises. Prior to Intigua, Tomer spent six years at Check Point, where he managed its Intrusion Prevention System (IPS) Software Blade from concept to market, generating $100M in revenue in the second year. Tomer has an M.B.A. from Tel Aviv University and a B.S. in computer science and is an enthusiastic kite surfer.
Asaf Yigal is co-founder and VP of Product at Logz.io. In the past he was co-founder of social-trading platform Currensee, which was later sold to OANDA. Yigal was also an early employee of server performance monitoring company Akorri and storage resource management startup Onaro, both of which were sold to netapp. A Techion graduate, he created an AI algorithm on naval warfare for the Israeli military.
Summary
ELK (Elasticsearch, Logstash, and Kibana) is the leading open-source, log-analytics platform that is used by companies including Netflix, Verizon, and Bloomberg to prevent and troubleshoot problematic events in their systems. We will first discuss the various use-cases of using ELK. From Ops monitoring, APM, forensics to security monitoring and business intelligence.
In the hands-on part we will train attendees on how to get started with ELK by shipping, parsing, and analyzing log data and then visualizing the events to understand them. As part of the hands-on session, we will learn how to leverage ELK to monitor system and application performance using dockerized, collectd/collectl containers.
To get the best learning experience, attendees should bring their own laptop, have access to a machine that generates logs and be ready to run the hands-on exercises with us.
Break
Linux Metrics

Nati Cohen
Solütions Engineers @ FewbytesNati Cohen is an operations consultant at Fewbytes, where he helps companies get the most out of their production environments. Before Fewbytes, Nati had a diverse experience in software development, *nix administration and security in the Intelligence corps and few start-up companies. To keep things interesting, Nati is also a research assistant at the DEEPNESS Lab in IDC Herzliya, looking into future network and cloud architectures.
Summary
While you can learn a lot by emitting metrics from your application, some insights can only be gained by looking at OS metrics. In this hands-on workshop, we will cover the basics in Linux metric collection for monitoring, performance tuning and capacity planning. How to choose effective metrics? What is the best way to collect them? and more...
Slides
Monitoring for Developers

Roman Landenband
VP R&D @ Hermetic.ioBack when doing fancy things on the web was called DHTML and just before the first high-tech bubble, Roman was already working the industry. He got to do backends, frontends and mobile apps. These days he does projects for Big-Co's and part time startup / open source / silly apps. Follow him on Github github.com/romansky and checkout his blog www.uniformlyrandom.com.
Summary
"Developers, developers, developers.. " - The inventor of "Ballmer Peak"
Gather around as we get our hands dirty with code and tools to help you with monitoring your application and JVM level metrics. This workshop is all about coming to the office the next morning and putting this new found knowledge to use. You will be provided with a base image of Ubuntu with pre-installed Java application to which you will add monitoring and use different tools to investigate and understand whats going on inside.
Some of the tools we will use:
- JMX
- jvisualvm
- async/sync code timing
- MDC
- Coda Hale's "metrics"
- ELK
- Grafana
Organizing Committee
This conference is a community effort by and for people who do monitoring daily and care about monitoring. The organizing committee are all volunteers and sponsorships cover the direct costs of the conference.


Nir Cohen
problem solver @ gigaspacesnir cohen was the ops team leader at fring and now works for gigaspaces. he's a relatively short, brown eyed human being who loves animals and holds true to ethics as a life path. he also likes to walk long distances, breathe and eat lettuce salad. you can find nir at work, roaming the streets or at home.