About Statscraft
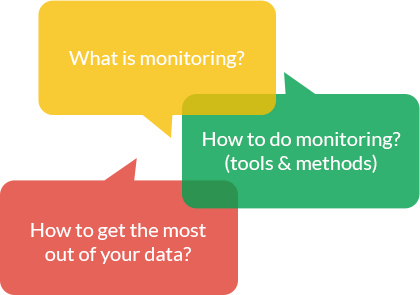
This conference is all about making monitoring easier, more accessible and more productive
Monitoring is crucial for detecting problems, optimizing performance, capacity planning, improving user experience and business impact... Yet in many companies, monitoring is an afterthought leading companies to miss out on the value of the data they collected. We often hear that "monitoring is hard" - and it can be, unless we do something about it.
Agenda
*this conference is Kosher and all talks are in biblical Hebrew
Gathering and signup
Opening Welcome
Summary
We'll dazzle you with our warming welcome.
How to Monitor a Business?

Yaniv Shalev
VP | AOL Israel Site Lead | CTO at ConvertroStrong experience with leading holistic team and product development from idea to GA highly aligned with business goals
Summary
In this talk we will emphasize the need to take holistic approach to monitoring and using monitoring as a competitive advantage (I’m calling it, “the 4 layer monitoring model”).
We will discuss the maturity of monitoring from the simple infrastructure layer we all know through service based monitoring, to insight/event driven data monitoring and finally monitoring our entire business.
As an analytics solution we wanted to treat our data as we treat our customers business.
YouTube Video
Tales of an alert-fatigue survivor
Eliran Ben-Zikri
Production Engineer at SimilarWebWith one functional ear and vast experience in networking & security, Eliran Ben-Zikri is a Production Engineer at SimilarWeb where he fell in love with anything automated and writing code for all *nix based systems.
Summary
For the past two years, the production engineering team at Similarweb has gone through a dramatic makeover.
We had to redefine how we collect, monitor, visualize metrics and cherry-pick what should wake us up at night.
In this talk I'll describe our journey as a team, the decisions we made, the goals we tried to achieve and the tools we ended up using.
YouTube Video
Break
Monitoring Big Data Systems Done "The Simple Way"
Demi Ben-Ari
co-founder and CTO at a stealth mode startupDemi Ben-Ari is co-founder and CTO at a stealth mode startup.
Demi has over 9 years of experience in building various systems both from the field of near real time applications and Big Data distributed systems.
Describing himself as a software development groupie, Interested in tackling cutting edge technologies.
Demi is also a co-founder of the “Big Things” Big Data community
Summary
Once you start working with distributed Big Data systems, you start discovering a whole bunch of problems you won’t find in monolithic systems.All of a sudden to monitor all of the components becomes a big data problem itself.
In the talk we'll mention all of the aspects that you should take in consideration when monitoring a distributed system once you're using tools like:
Web Services, Apache Spark, Cassandra, MongoDB, Amazon Web Services.
Not only the tools, what should you monitor about the actual data that flows in the system?
And we’ll cover the simplest solution with your day to day open source tools, the surprising thing, that it comes not from an Ops Guy.
YouTube Video
Experimenting on Humans
Dalia Simons
Server Engineering at WixI've been developing software for over 10 years. in the last 5 years i've been part of the server engineering team @ wix.
I've been working on the experiments system for the last 2 years
Summary
How do you rollout a new feature to customers? how do you monitor it? decide if it's successful?
In this lecture i will share how we use our experiments system at wix to help us monitor the success of new features across different geos/ locales / devices.
We can then make better decisions and quickly react by closing problematic features
YouTube Video
Break
A word from our sponsors

The Sponsors
Our Amazing SponsorsWho made this conference possible
Thank you!
Summary
Our fabulous sponsors will present themselves shortly.
BI & Business Alerting

Assaf Milman
BI Manager @ ForterBI manager at Forter since Jan 2015.
Responsible for delivering business insights to management, team leaders and other stakeholders.
Developing the company's business oriented alerting system.
I brew my own beer - best served before writing a new feature..
Summary
In this talk Assaf Milman from Forter will explain how we approach monitoring of “incoming” data after it was written to disk (at rest). The first problem we solve is business KPI based alerts. These require per-customer thresholds that also have time-seasonality. We will describe our dynamic thresholding algorithm to detect analytical and engineering anomalies that affect the business. More importantly this project is part of the BI team which is not officially part of R&D. The second problem we solve is data quality and consistency across different data stores. Our naive approach of “asserting” data was written to database after each system test/probe outlived its usefulness. We will describe why, and how the data reconciliator solves this problem differently. Related topics such as schema validation, data-remediation, pii redaction and data migration errors will also be discussed.
YouTube Video
Lunch
Another word from our sponsors
The Sponsors
Our Amazing SponsorsWho made this conference possible
Thank you!
Summary
Our fabulous sponsors will present themselves shortly.
Monitoring what customers think

Elena Levi
Analyst at SingularBI Extremist
Analyst by day, Statscraft organizer by night
Summary
We all (should) agree that monitoring customer activity is very important and that monitoring support tickets is highly recommended as well. But what about the content of these tickets? In this talk we will discuss how we categorize our support tickets and how it affects our R&D decisions
YouTube Video
Alerting mistakes

Eran Zimbler
DevOps Extraordinar at Rumble NewsAfter working for checkpoint software and AVG I finally moved out of security related companies and started working at Rumble News, there I have evolved into a cloud savvy/monitor watcher/scripts fixer/solutions finder/devops.
While starting to feel too old for this shit, I have learned that clouds like old time servers rain at the worst of times.
Summary
Short walktrough of all the mistakes I did with alerts and alerting systems during the last 10 years.
YouTube Video
Monitor Your Business (no developers required)

Arik Fraimovich
Founder at RedashIn the past years, I have been dealing with all aspects of data -- from how to load it properly and in scale and then how to present it to the end users.
In the process I've created Redash, an open source data collaboration platform, that helps organizations democratize their data access.
These days I'm working hard on creating a sustainable business around Redash.
Summary
When talking about monitoring usually what comes to mind is technical metrics like CPU, disk space, memory, time to server a request, etc. Those are nice, but those KPIs (usually) don't drive your business. It's how many interactions a user had, how much money we generated and how many new users joined is what driving the business. And as a business, those are the KPIs we should monitor and care about.
Previously you had to beg for time from your developers to provision business metrics collection. In this talk I would like to show you how to do this without any developers involved by just using SQL and a tool like Redash.
The Pareto Logging Principle: 97% of Logged Errors are Caused by 3% of Unique Errors

Chen Harel
Chief DevOps at TakipiChen is Co-Founder & Chief DevOps @ Takipi, focusing on high-scalability and availability.
Previously, Chen was a team lead at Autodesk, where he led the development of the company's flagship Cloud infrastructure.
Prior to that Chen was a lead infrastructure engineer at VisualTao.
Apple(s) person.
Summary
In this session we'll share stats from monitoring over a 1,000 applications in production, and uncover the most common cause and cost of operational noise
YouTube Video
Why We Love Prometheus (And You Should, Too!)

Gil Fliker
Operations Manager at OutbrainFrom Dev to DBA to Operations to DEV... the future
Running things at scale for a while.
Currently Operations manager @Outbrain
Building Outbrain's infrastructure from day one.
Summary
If like me you are trying to figure out what is going on in your data center, who is consuming your resources? and your method of choice is collecting numbers over time? then I got a few stories for you.
In this session you will hear and see how Prometheus is put to work at Outbrain any why we like it.
We will be chatting about a few use cases of using Prometheus and lessons learned.
YouTube Video
Newborns - a very difficult production system

Gil Zellner
Cloudify developer at GigaspacesCreated by 2 engineers in the 80s, survived Israel Institute of Technology in the 2000’s, worked at Gett and a few others, currently works on Cloudify at Gigaspaces.
Summary
Newborn babies are difficult. like your production system. this outlines everything from monitoring, services, analytics and such. humorous yet accurate.
YouTube Video
Domain-Driven Monitoring
Asaf Kotzer
Chief Architect at SolutoAsaf is a software developer. He's currently the Chief Architect at Soluto, working on infrastructure and products, as well as continuously improving the development process. Asaf is a 8200 alumni and has a BSc in Computer Science and Cognitive Science from The Hebrew University in Jerusalem.
Summary
Monitoring, like with non-functional requirements, has traditionally been looked at from a dev/ops/devops perspective. But monitoring is not about tech, it's about business. We will show an alternative for how a domain-centred dialog can lead to better monitoring, echoing good old DDD concepts and aiming toward the breaking of more silos.
YouTube Video
ETW - Monitor Anything, Anywhere, Anytime

Dina Goldshtein
Senior Software Engineer at AternityDina Goldshtein is a Senior Software Engineer at Aternity.
Aternity builds performance monitoring tools that run on millions of PCs and mobile devices.
Dina is on the team responsible for the core collection mechanism, which hooks low-level Windows events and collects performance information from a variety of sources.
Since starting at Aternity, she worked a lot on boot performance monitoring, identifying bottlenecks in the Windows boot process.
Summary
Event Tracing for Windows is Microsoft’s structured logging infrastructure.
Although it supports emitting your own custom messages, the cool thing about it is that Windows and many other Microsoft frameworks come built-in with thousands, if not tens of thousands of trace-points which allow you to monitor basically anything, on demand, both during development and on production.
This includes standard metrics such as memory and CPU, but also more exotic things such as WCF functions, .NET exceptions, thread call-stacks, and even the Windows boot process!
In this session we will see how to use freely available tools to monitor your applications and environments.
YouTube Video
Spam Management and Demand Control in Monitoring Systems

Brian Smith
Production Engineer at FacebookBrian has been a PE at Facebook for 4 years, and has spent his time building and maintaining the large scale stream processing and monitoring systems. Currently working on ODS and Scuba.
ODS is Facebook's time series database, detection system, and query engine that handles trillions of data points a day. Scuba is a real time event and log query engine for analyzing unstructured data streams that ingests millions of events per second.
Summary
You've convinced everyone of the importance of monitoring their services, but now you suddenly have a problem.
What are you going to do with all that data?
In this talk we will discuss the delicate balance between ease of use and protecting the monitoring system from the well meaning but clueless people who put time stamps in the names of their metrics.
We will discuss the Facebook monitoring team's general philosophy around demand control, then dive into specific details about how we keep the system up, from time series clustering and spam detection algorithms to rate limiting and blacklisting policies.
YouTube Video
Break
Riemann workshop

Roey Berman
Senior Software Engineer at ForterI'm a full-stack software developer with experience ranging from server infrastructure to mobile/web UI development. My passion is building highly scalable distributed services.
I'm obsessed with well-designed software and elegant and readable code.
My main language these days is Python, but I'm also considerably experienced with C, C++, C#, Go, Java, Perl, JavaScript and Clojure.
I'm active in the open-source community and have contributed to various projects (https://github.com/bergundy/)
Summary
In this workshop we will get a chance to see Riemann in action and get some hands-on experience. We'll start with a brief introduction to Clojure and continue to dive into Riemann's powerful stream processing language. We'll go over some common use cases like monitoring queues, long running processes and scheduled tasks. To conclude we'll learn how to test our Riemann configuration using Riemann's built-in testing framework.
The Next Linux Superpower: eBPF Primer

Sasha Goldshtein
CTO of Sela GroupSasha Goldshtein is the CTO of Sela Group, a book author, international conference speaker, consultant, and trainer. Sasha specializes in performance investigations, production debugging, and loves bleeding edge monitoring tools.
Summary
Imagine you're tackling one of these evasive performance issues in the field, and your go-to monitoring checklist doesn't seem to cut it. There are plenty of suspects, but they are moving around rapidly and you need more logs, more data, more in-depth information to make a diagnosis. Maybe you've heard about DTrace, or even used it, and are yearning for a similar toolkit, which can plug dynamic tracing into a system that wasn't prepared or instrumented in any way.
Hopefully, you won't have to yearn for a lot longer. eBPF (extended Berkeley Packet Filters) is a kernel technology that enables a plethora of diagnostic scenarios by introducing dynamic, safe, low-overhead, efficient programs that run in the context of your live kernel. Sure, BPF programs can attach to sockets; but more interestingly, they can attach to kprobes and uprobes, static kernel tracepoints, and even user-mode static probes. And modern BPF programs have access to a wide set of instructions and data structures, which means you can collect valuable information and analyze it on-the-fly, without spilling it to huge files and reading them from user space.
In this talk, we will introduce BCC, the BPF Compiler Collection, which is an open set of tools and libraries for dynamic tracing on Linux. Some tools are easy and ready to use, such as execsnoop, fileslower, and memleak. Other tools such as trace and argdist require more sophistication and can be used as a Swiss Army knife for a variety of scenarios. We will spend most of the time demonstrating the power of modern dynamic tracing -- from memory leaks to static probes in Ruby, Node, and Java programs, from slow file I/O to monitoring network traffic. Finally, we will discuss building our own tools using the Python and Lua bindings to BCC, and its LLVM backend.
Sponsors


Organizing Committee
This conference is a community effort by and for people who do monitoring daily and care about monitoring. The organizing committee are all volunteers and sponsorships cover the direct costs of the conference.


Statscraft Team
The Amazing Statscraft ComitteeThis conference is a community effort by and for people who do monitoring daily and care about monitoring.
The organizing committee are all volunteers and sponsorships cover the direct costs of the conference.